IdealSpot’s Filtered Search tool allows you to search a region by combining multiple datasets to understand where the best areas are that matches your specific criteria. Then rank how important each insight is to see the overall Score for an area by giving more weight to specific insights through our ranking slider.
Watch this video below for an overview.
Real World Example
Let’s say that you’re opening up food truck specializing in Asian fusion cuisine in the city of Seattle, and you want to know where your customers are based on several particular demographics you have in mind. You want to locate the neighborhoods that have a more substantial number of Asians, between the ages of 25 to 35, making between 45k and 60k, with the top 10% of spending for lunch at restaurants, and not to mention the areas people are searching for Asian cuisine and food trucks.
These are just five of our 35+ other insights you can input into our Filtered Search tool to see how each block group ranks accordingly.
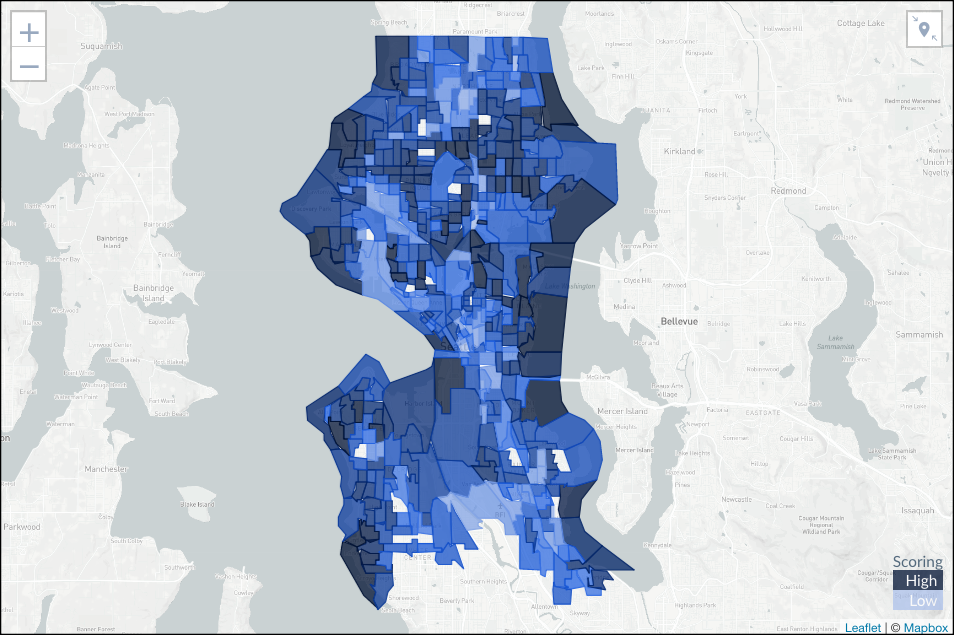
The darker colors represent a higher ranking, or score, based on what you selected and how much weight is given for each insight. You can weigh each of your categories differently depending on how important it is to you by adjusting the range slider to show the top, middle, or bottom percentages.
For example, since we want to see the top 10% of spending for lunch, we would adjust the slider to have a range of 90 - 100%. Then when each block is clicked on, we can see how close that area is to the top 10% by looking at the Score.
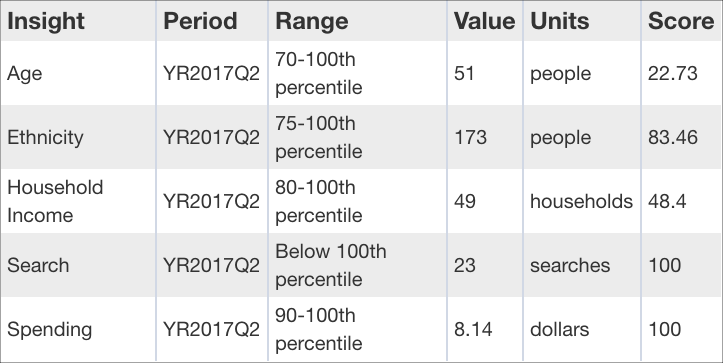
We can see that $8.14 is within the top 10% because the Score is 100. Anything that is below the top 10% will receive a Score of 99 or lower (see example below).

You can easily see the overall rank of an area and compare it to other areas by looking at the overall Score.
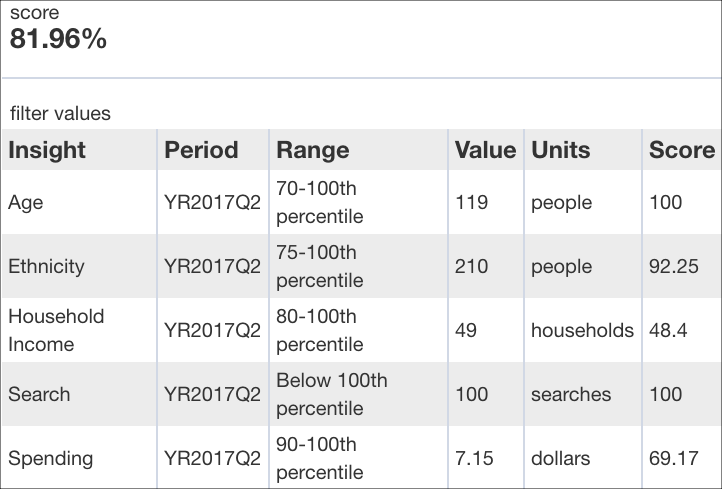
In this block, we can see that the age we selected (ages 25 to 35) has a Score of 100 as 119 people represent the top 30% of the total population with ages 25 to 35 living in Seattle. Moreover, the ethnicity we chose (Asian), is just below the top 75 - 100% as it has a Score of 92.25, with 210 people living in that area who identify themselves as Asian.
Upon running your report, you can quickly view the top five areas with the best overall score.
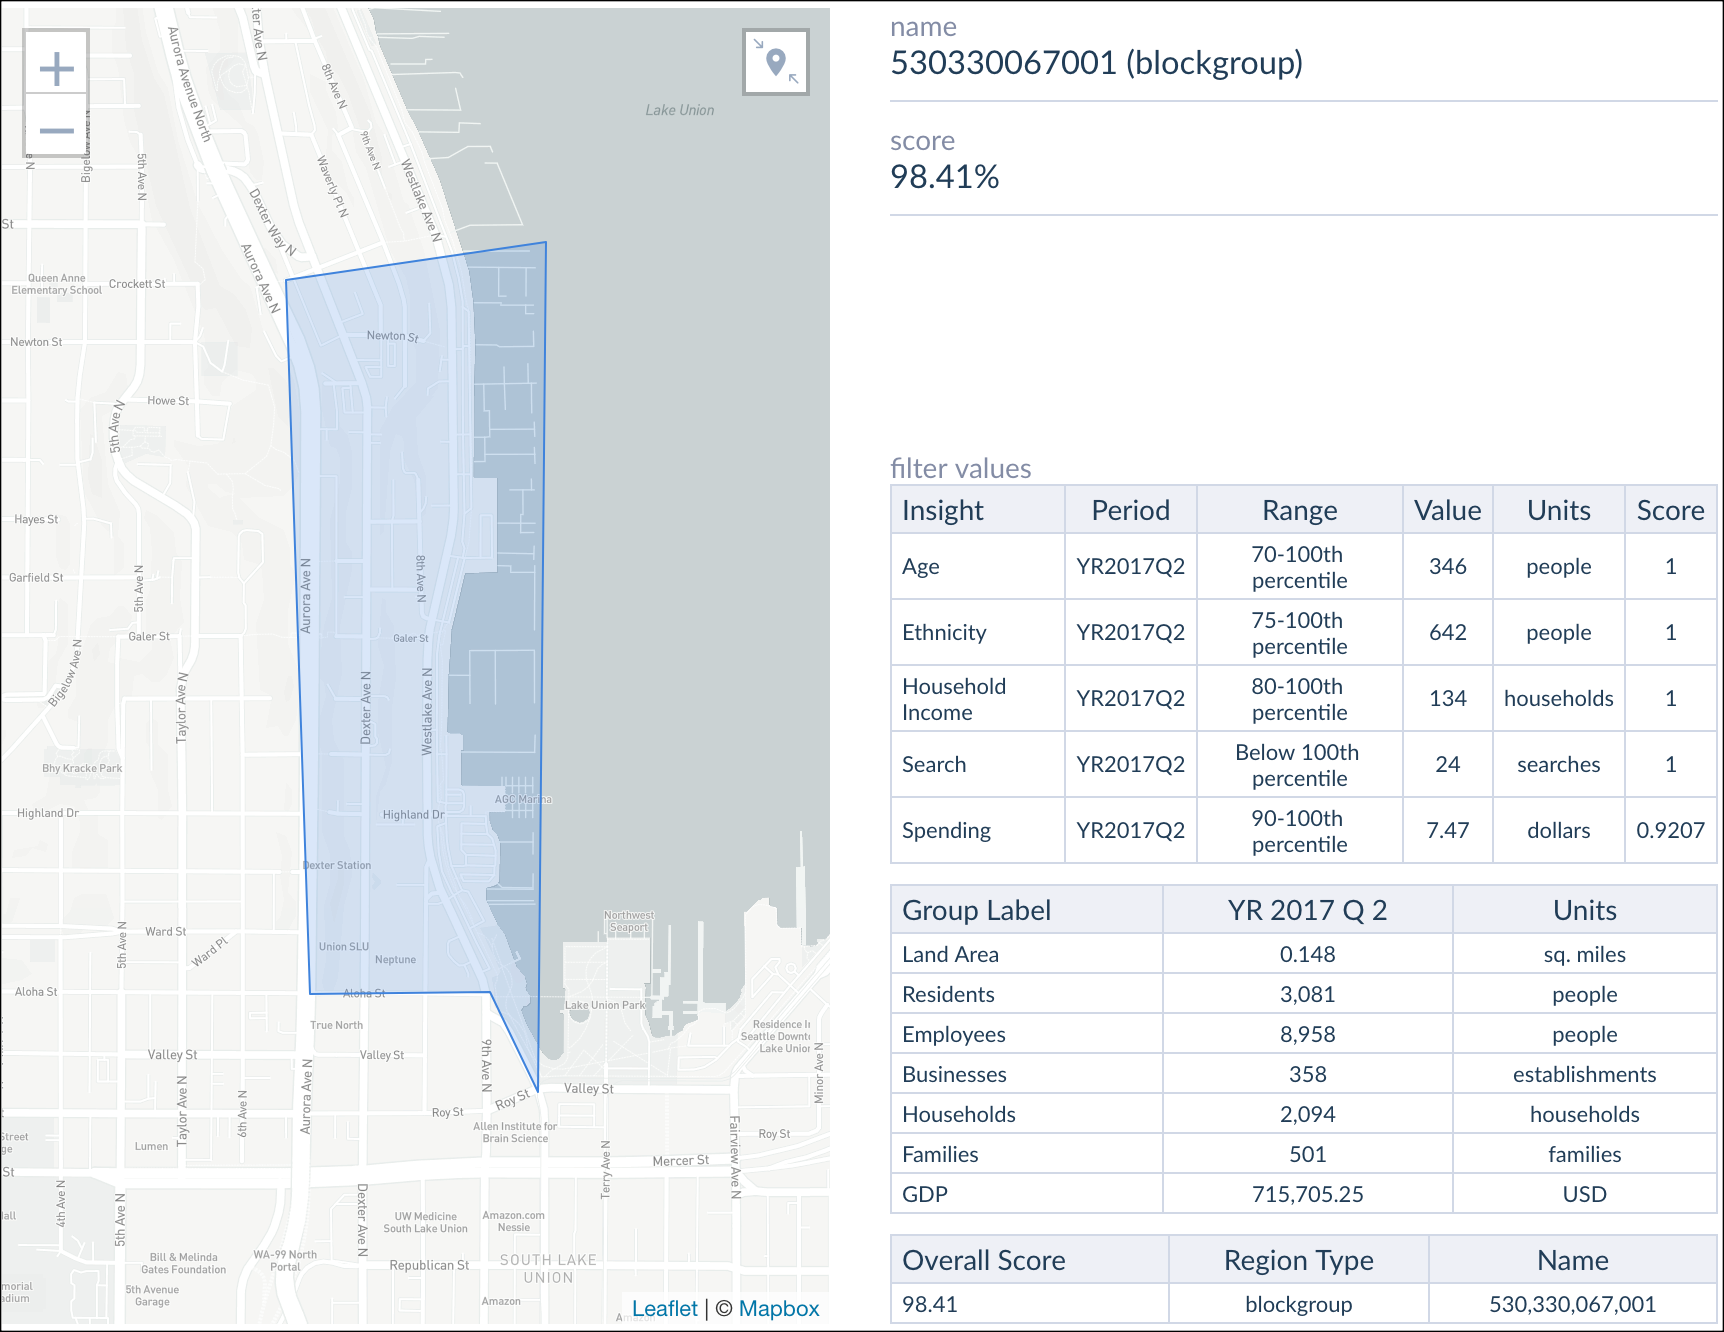
Then export these reports and share them with your team or your clients. Or download them as a CSV file to combine our insights with your own data.
Want to see this in action? Schedule a demo with one of our specialists and ask about how you can get a discount!