Moving between different data visualizations in location reports so that you are always getting the most value out of the data.
There are 5 types of Insight Visualization:
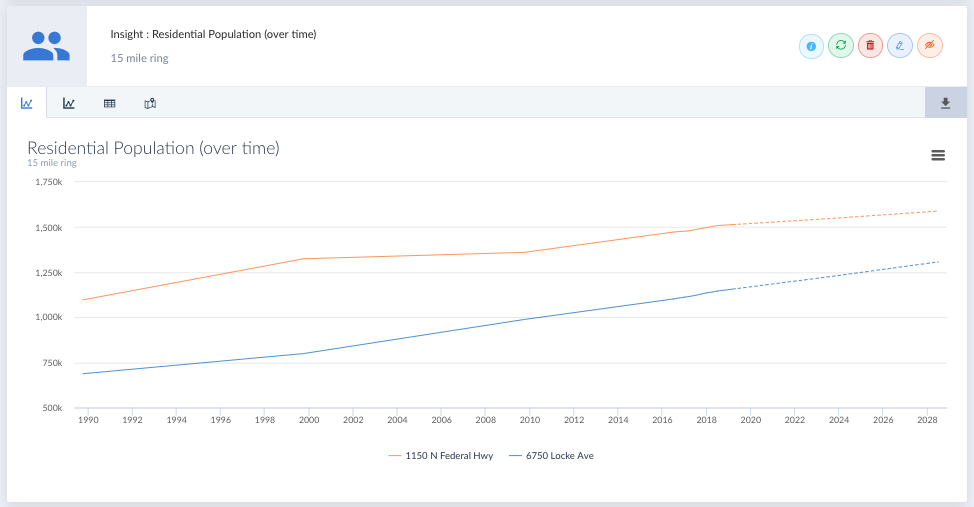
- Trendline Chart: displays the raw numbers in a trendline chart.
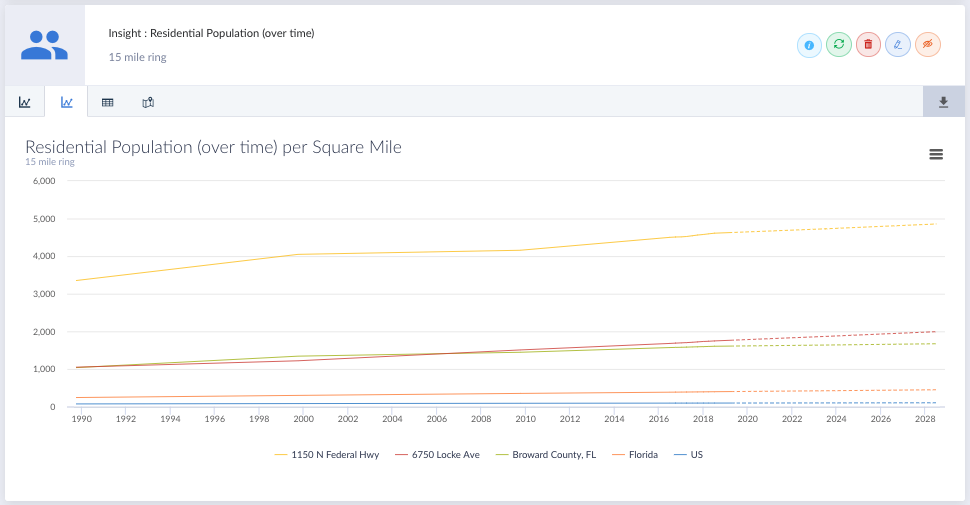
- Trendline Chart with values relative to "X": displays the data relative to a different data set. The second data set differs from insight to insight, but in most cases is the total population or land area.
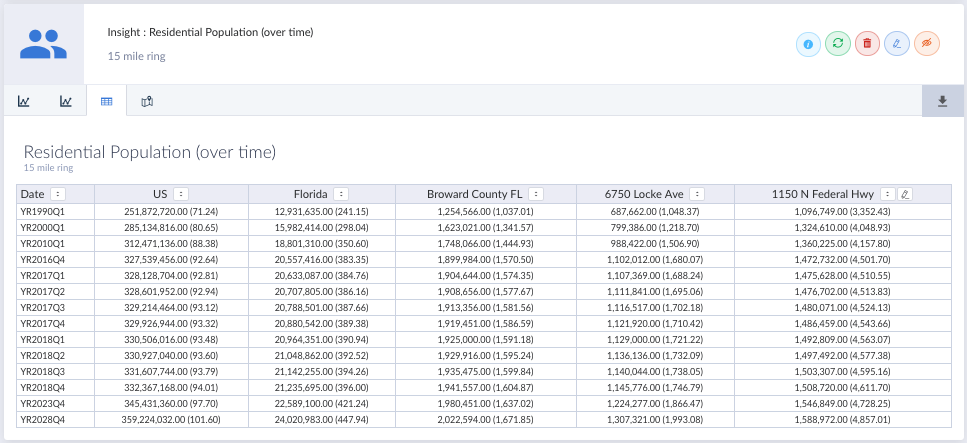
- Table: displays the data in a table view.
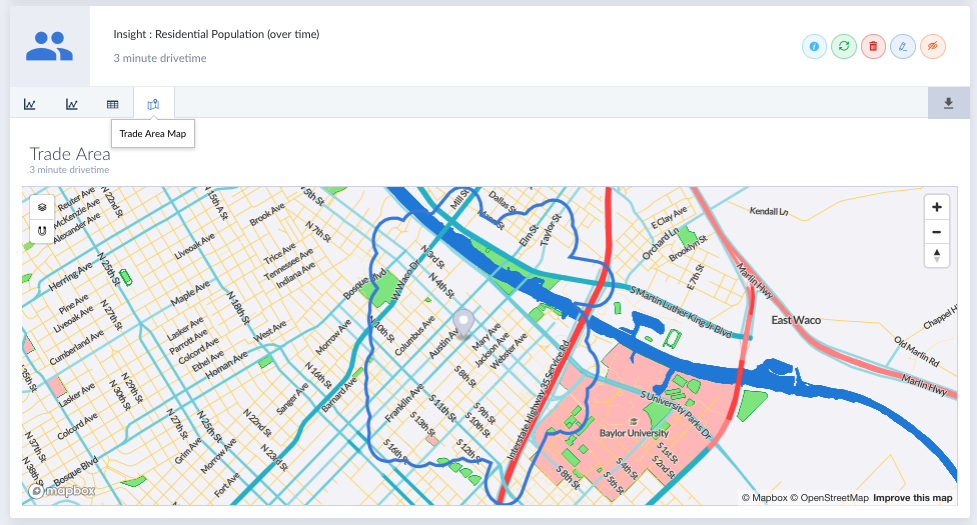
- Trade Area Map: displays a map of the area from which the data was pulled.